

Your website looks great. Do you know if anyone uses it?
Most owners I meet can’t answer that. They paid for a website, it launched, and nobody has looked at what visitors do on it since. Google Analytics answers that question, it’s free, and reading the basics takes a few minutes a day.
From working with many businesses, I noticed the ones growing fastest all have one thing in common: the CEO and the team look at the numbers every day. It’s part of their routine, and it’s how they make better decisions, fix what’s weak and keep growing.
Why I call it a red flag
After building sites for small businesses and agencies, I see the same pattern over and over: a business has a website but never installed Google Analytics. That’s a red flag. Google Analytics is free, it’s made by Google, and a basic setup takes minutes.
A new website looks great on launch day, but looks don’t tell you if it works. You want to know whether people click, or whether they land and leave two seconds later without scrolling past the first section. Data lets you fix and improve as you go instead of guessing.
What Google Analytics shows you
Once it’s connected, Google Analytics (GA4, the current version) shows how visitors behave:
- Which pages they view and how long they stay.
- Where they are: city and country.
- How they found you: Google search, social media, ads, or typing your address.
- What they click, with a little extra setup: the call button, the contact button, form submissions and bookings.
Six terms you need
These cover almost everything on the Home screen. The definitions follow Google’s own Analytics Help.
| Term | In plain words | In the screenshots |
|---|---|---|
| Active users | People who visited and actually interacted with the site | 4.7K in 90 days |
| Sessions | Visits. One person can make several. | 4.5K in 90 days |
| Events | Every tracked action: page views, scrolls, clicks, form submits | 43K in 90 days |
| Key events | The actions you care most about, like calls, form fills and bookings. Google used to call them conversions. | 26K, which is a problem (see below) |
| Engagement rate | Share of visits that lasted over 10 seconds, viewed 2 or more pages, or triggered a key event. Bounce rate is the rest. | Not on these cards |
| Channel | How the visitor arrived: Direct, Organic Search, Organic Social, Referral, Paid Search, AI Assistant | Screens 2 and 3 |
Screen 1: Home
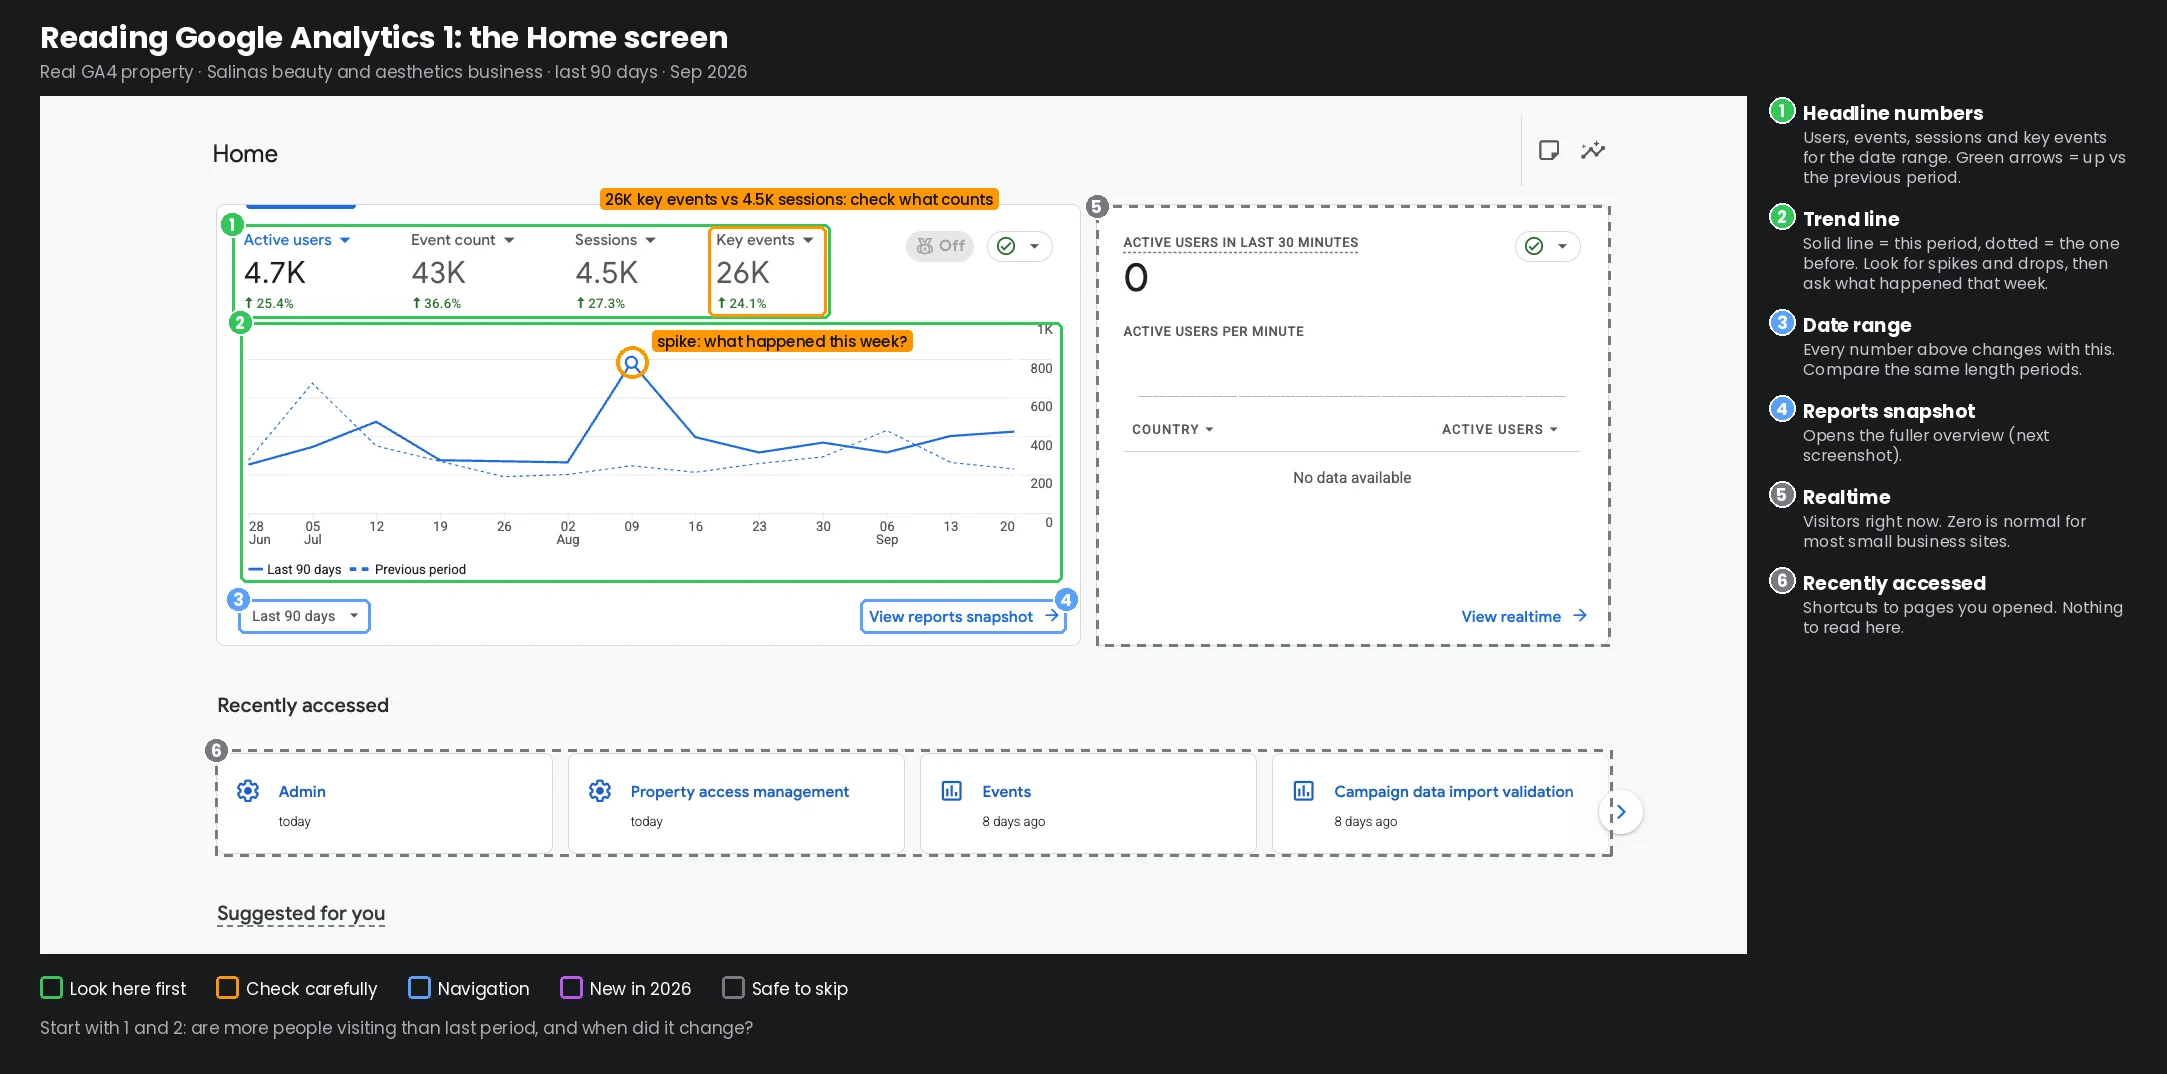
The graphic at the top is the GA4 Home screen for a real Salinas beauty and aesthetics business, last 90 days. It answers one question: are more people visiting than before?
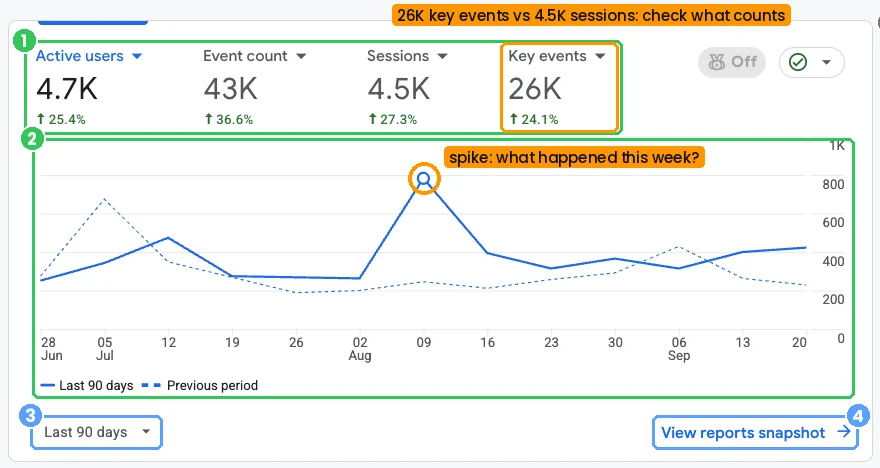
Start with the headline numbers and the trend line. Here every number is up 25% to 37% against the previous 90 days. That’s real growth. The solid line is this period and the dotted line is the one before, so you can see when it changed.
Then ask “what happened that week?” about any spike. This one peaked on August 14 at about 300 visitors, against a usual 40 a day. When we opened the data, most of those visits came from Singapore with no source at all. For a beauty bar in Salinas, that’s bots, not customers. A spike from a promo or an ad looks the same on this chart, which is why you check.
The orange flag: 26K key events against 4.5K visits. More key events than visits means something ordinary is being counted. On this site, page views, scrolls and first visits were marked as key events for most of the period: about 20,000 of the 26,000. The actions that really matter, bookings started, purchases, forms, call clicks and direction clicks, added up to under 200.
This matters twice. Google counts any visit with a key event as engaged, so when every page view is a key event, engagement rate reads about 91% no matter what visitors do. Your most useful signal stops meaning anything. Only mark real leads as key events: calls, form fills, bookings, purchases.
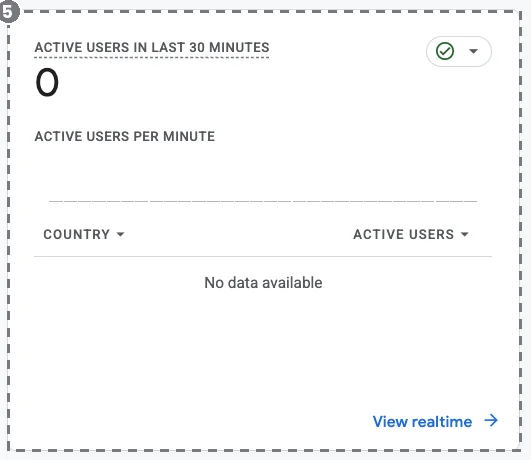
Realtime and Recently accessed are safe to skip. Zero visitors in the last 30 minutes is normal for a small site.
Screen 2: Suggested for you
Scroll down on the Home screen and you get three cards: where visitors come from, what they look at, and where they are.
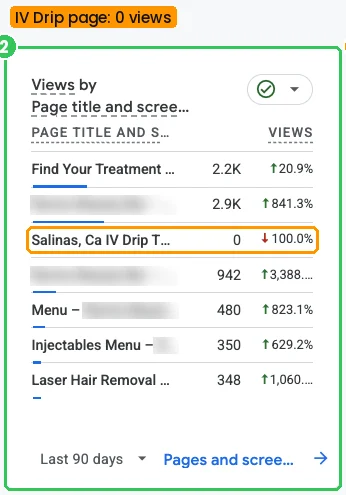
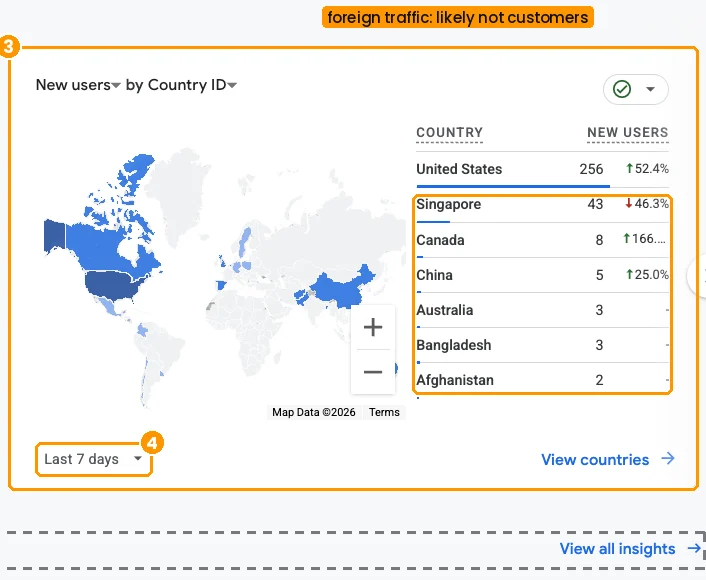
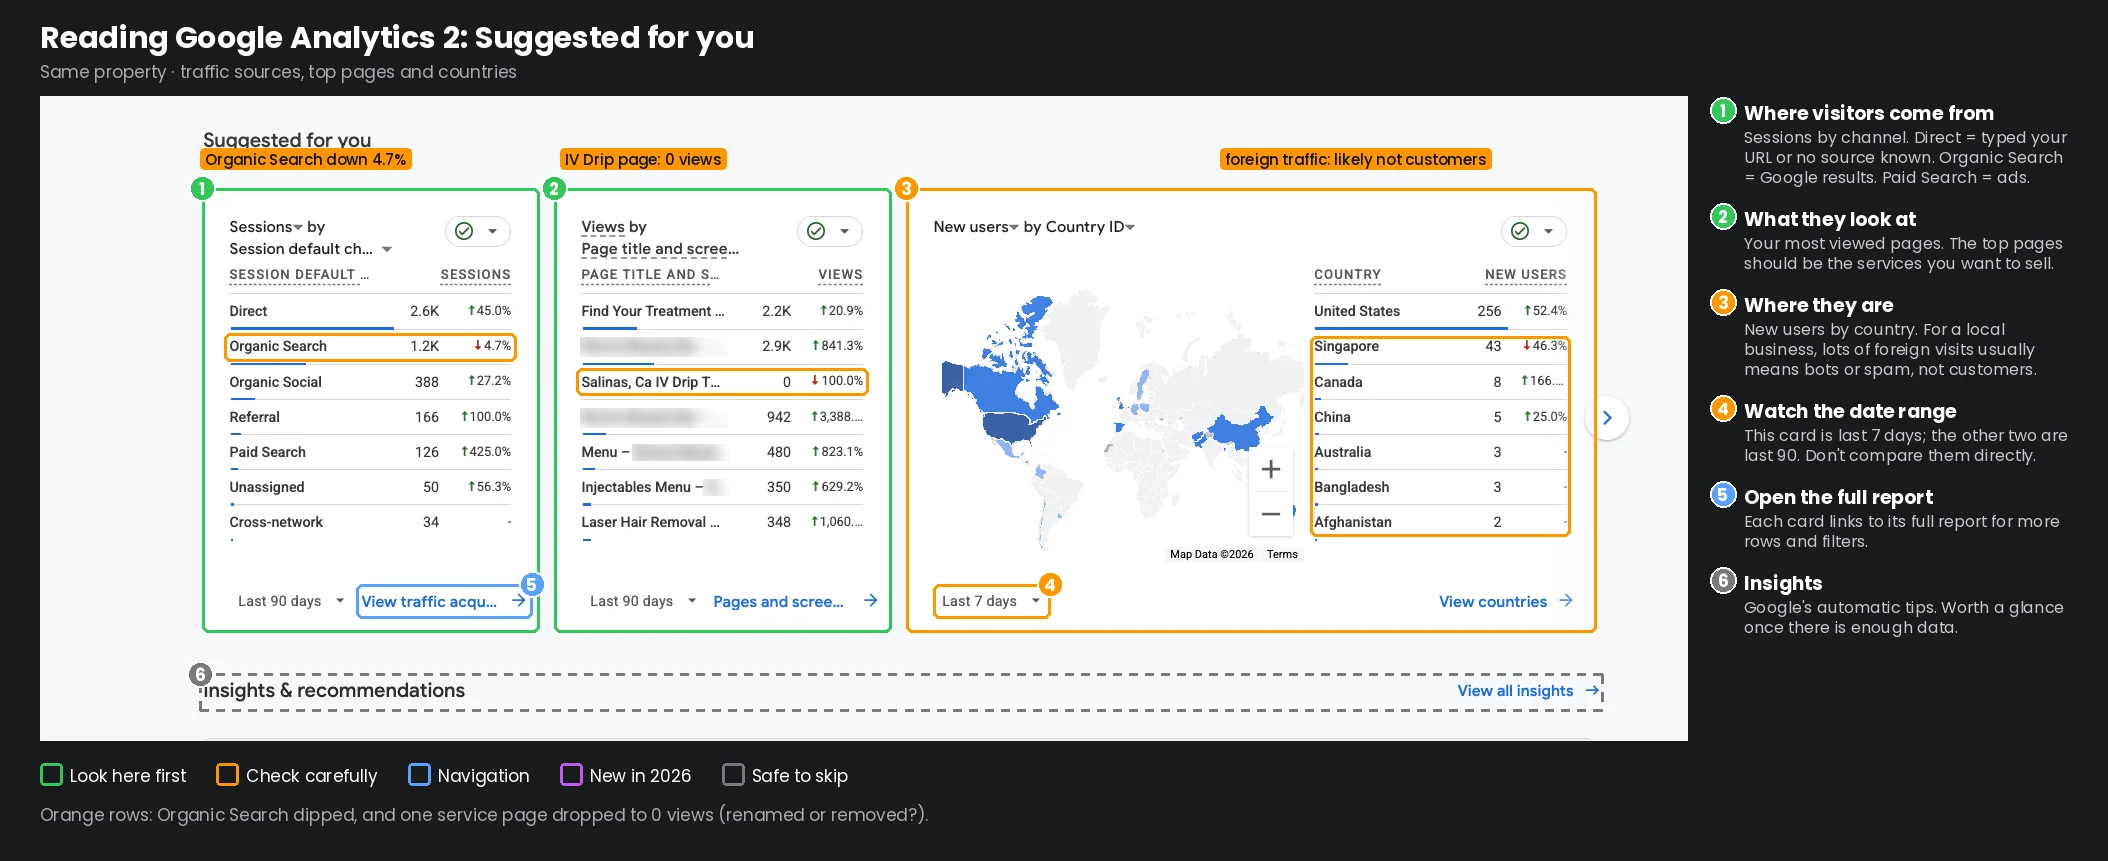 Where visitors come from Visits by channel. Direct means typed your address or no source known, Organic Search is free Google results, Paid Search is ads. Organic Search, down 4.7% Everything else grew, but visits from free Google results slipped a little. Worth a look in Search Console before it becomes a trend. Open the full report Each card links to its full report, with more rows and filters. This one opens Traffic acquisition. What they look at Your most viewed pages. The top of this list should be the services you most want to sell. A page at 0 views Not a lost page. This was the homepage’s old title; the card groups by title, so a renamed page shows up twice. Where they are New visitors by country. A local business’s real customers are almost all in its own country. Foreign traffic Singapore is second, ahead of Canada. For a Salinas beauty bar these are almost never customers; it usually means bots. Watch the date range This card shows the last 7 days; the other two show 90. Don’t compare them directly. Insights Google’s automatic tips. Worth a glance once your site has enough data.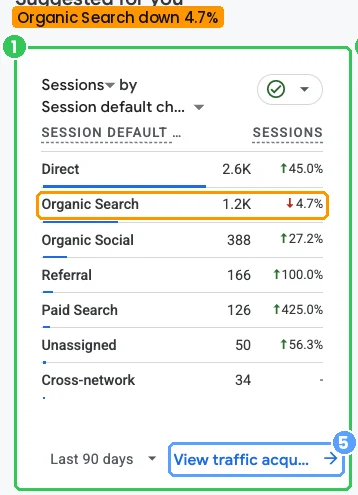
Orange rows: Organic Search dipped, and one page title dropped to 0 views.
Google Analytics 4, Suggested for you, a Salinas beauty and aesthetics business, September 2026.
This is screen 2, Suggested for you. Hover over any part for a quick explanation, or click it and the AI walks you through it.
Where visitors come from. Direct (2.6K) means they typed your address, or GA4 couldn’t tell the source. Organic Search (1.2K) is free Google results, and it’s the one number here that went down, by 4.7%, while everything else grew. That’s worth a look before it becomes a trend.
What they look at. The top pages should be the services you most want to sell. One row shows 0 views, down 100%, which looks like a page disappeared. It didn’t: that was the homepage’s old title. This card groups by page title, so renaming a page splits it into two rows.
Where they are. Watch the date range: this card shows the last 7 days while the other two show 90. Singapore is second, ahead of Canada. For a local business, a pile of foreign visits almost always means bots or spam, the same visitors behind the August spike.
Screen 3: Reports snapshot
Click “View reports snapshot” on the Home screen for the fuller overview, here for the last 28 days.
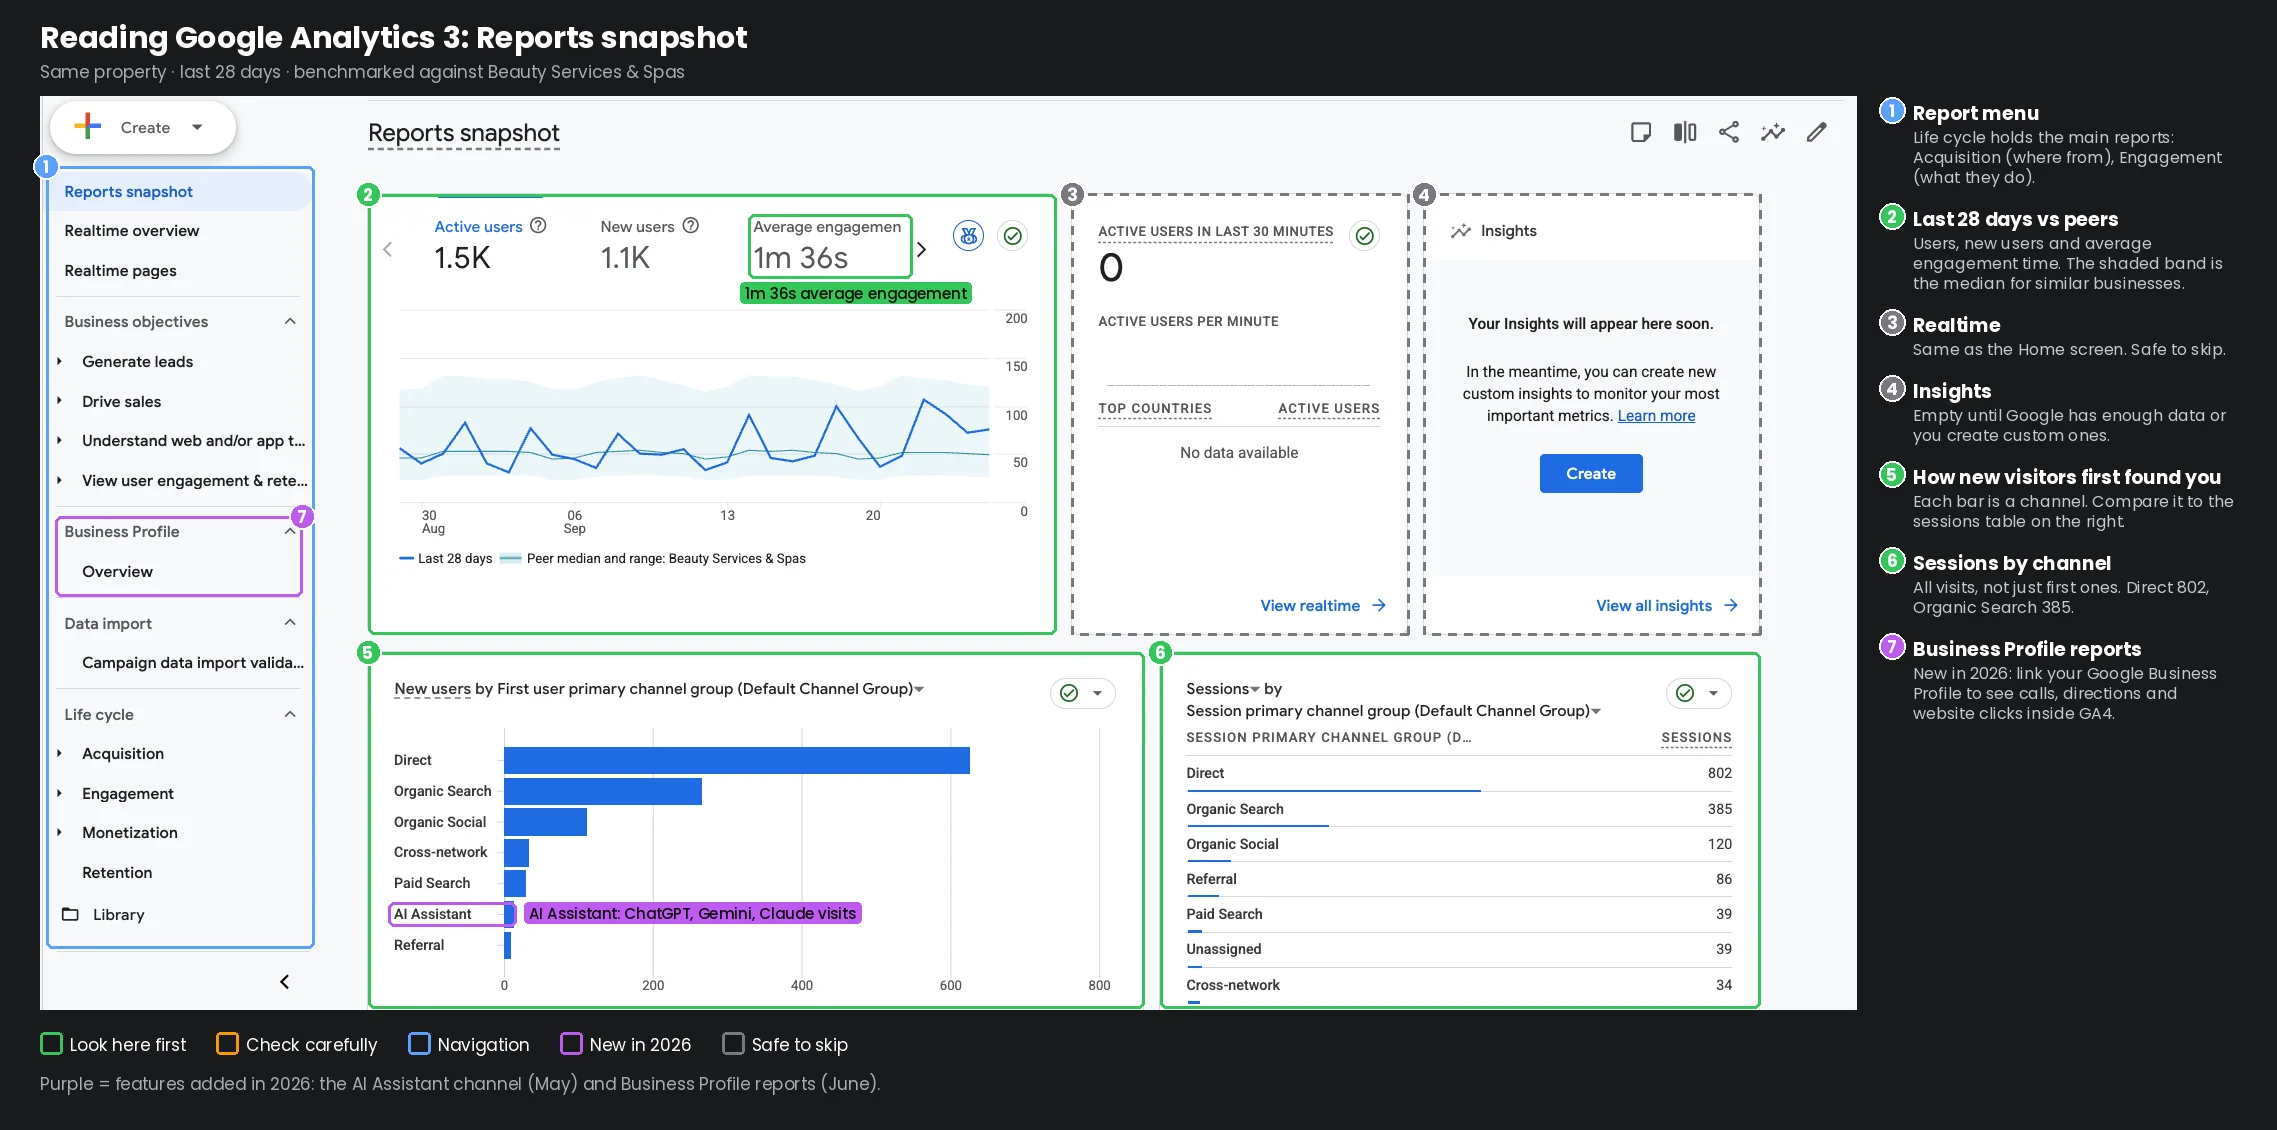 Business Profile reports New in June 2026: link your Google Business Profile to see calls, directions, bookings and website clicks inside GA4. Last 28 days vs similar businesses The shaded band is the middle half of similar businesses (Beauty Services & Spas). Above it means you’re doing better than most of them. Average engagement time 1m 36s: how long the page was actually in front of visitors, on average. A few seconds would mean people land and leave. Realtime The same as on the Home screen: visitors in the last 30 minutes. Safe to skip. Insights Empty until Google has enough data, or until you create your own. How new visitors first found you Each bar is the channel that brought someone the very first time. Compare it with the sessions table on the right. AI Assistant, new in 2026 Since May 13, 2026, GA4 puts visits from chatbots like ChatGPT and Gemini here. Small today, worth watching. Google’s AI Overviews don’t count. Sessions by channel Every visit, not just first ones: Direct 802, Organic Search 385, Organic Social 120 in 28 days.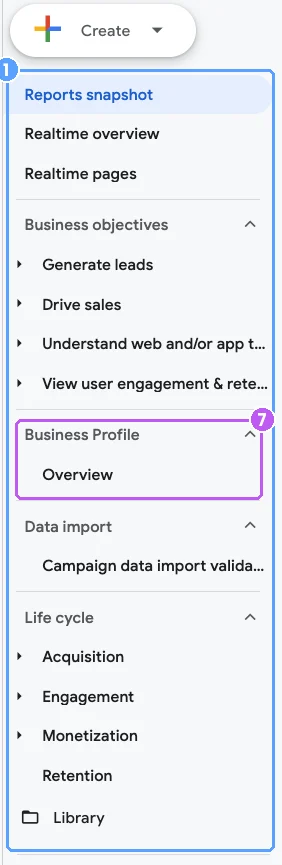
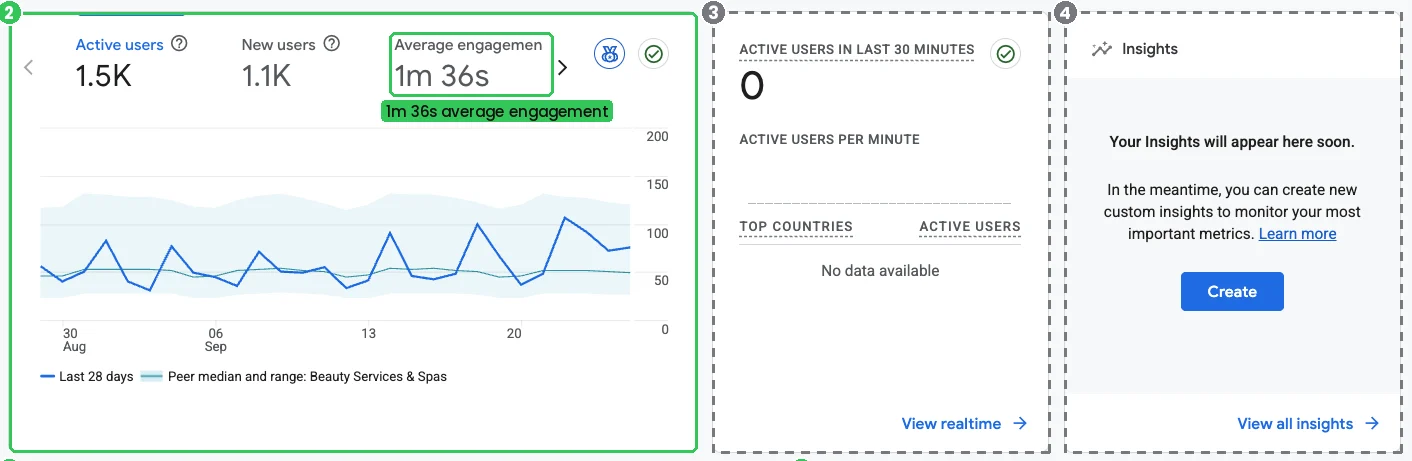
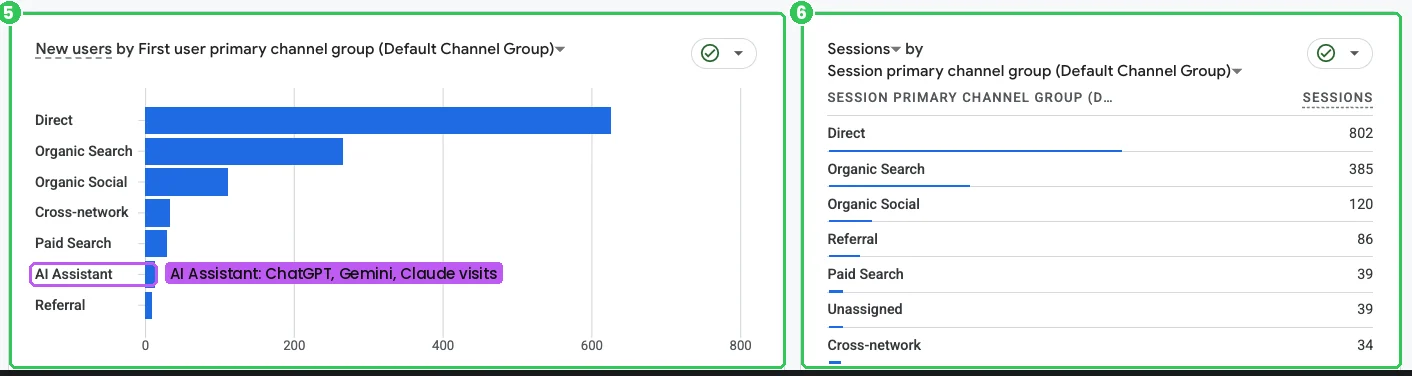
Purple marks what’s new in 2026: the AI Assistant channel (May) and Business Profile reports (June).
Google Analytics 4, Reports snapshot, last 28 days, benchmarked against Beauty Services & Spas, September 2026.
This is screen 3, Reports snapshot. Hover over any part for a quick explanation, or click it and the AI walks you through it.
Last 28 days against similar businesses. GA4 can compare you with businesses like yours (here, Beauty Services & Spas). The shaded band is the middle half of that group. Average engagement time was 1 minute 36 seconds, so visitors are reading, not bouncing.
How visitors found you, and how they came back. The left card is new visitors by the channel that first brought them. The right card is every visit, by channel: Direct 802, Organic Search 385, Organic Social 120.
Two things new in 2026, in purple:
- AI Assistant. Since May 13, 2026, GA4 groups visits from chatbots like ChatGPT and Gemini into their own channel. Here it’s small, about a dozen new visitors in 28 days, but it’s worth watching. It doesn’t include Google’s own AI Overviews.
- Business Profile reports. Since June 2026 you can link your Google Business Profile to GA4 and see calls, direction requests, bookings and website clicks next to your website numbers.
What to check, and how often
The fastest-growing businesses I work with look at their numbers every day. That doesn’t mean an hour in reports. It means two minutes with the Home screen:
- Daily: the headline numbers and the trend line. Anything jump or drop?
- Weekly: key events. How many calls, forms and bookings did the site bring in?
- Monthly, the three checks: the traffic trend against last month, where visitors came from, and what they did on the site.
Tie every change back to your own marketing. Posted on Instagram, ran a promo, changed the homepage? That’s where the answer to “what happened that week” usually is.
Next: Google Search Console
Google Analytics tells you what visitors did once they reached your site. Google Search Console tells you what happened before they clicked: which Google searches showed your site, how many times, at what position, and how many people clicked. It’s free, it’s also made by Google, and it’s the next lesson: why your website isn’t showing up on Google. After that, heatmaps: where on a page visitors look, scroll and click.
Summary
If your website doesn’t have Google Analytics, set it up now: even the basic setup starts collecting data you’ll use. Then read the Home screen for two minutes a day. More visitors than last period? When did it change? Are your key events real leads? In this example, the numbers showed real growth, a bot spike, a renamed page and a key event setup counting page views as leads. Not one of those is visible from the website itself.
Not sure your setup is right? Get a free Google Analytics setup check: we’ll look at whether it’s installed, which key events count, and what it’s missing. Want to know whether Google shows your site at all? Read the Search Console lesson. Rather have the numbers come to you? The Website Report sends you your Google Analytics and Search Console numbers every month, in plain words, plus your Google rankings.